

Infrastructure Wars

The conflict has pivoted from tanker wars in the Strait to infrastructure wars in the Gulf region.
The war is turning physical, with gasoline shortages emerging in Rotterdam and Singapore, which could exacerbate the situation now that the US has threatened to ban LNG exports. This ban can also adversely affect US refineries and prompt retaliation from countries that export heavy crude.
Overnight, there were drone attacks that caused fires at two state-owned refineries in Kuwait, and a drone fell at a key energy export terminal in Saudi Arabia.
Meanwhile, Israel attacked the South Pars gas field without US consent (albeit the Axios report suggests the US gave approval), which provoked the President by threatening a complete blowup of the Pars field because it affects ~70–80% of Iran’s domestic natural gas supplies, which fuels domestic electricity generation, heating, and petrochemicals.
In response, Iran retaliated by striking the Ras Laffan Industrial City LNG facility in Qatar with ballistic missiles (what seems to be a Fateh‑110, Zolfaghar, Dezful, or Kheibar Shekan missile) launched from Iran.
The physical market is experiencing serious stress, with crude prices in Oman rising to $166/barrel, and sharply above Brent (see Figure 1).
These stresses also prompted a more kitchen-sink approach to the oil price shocks. Treasury Secretary Bessent said the US might “unsanction” Iranian barrels already on the water and suggested Kharg Island could become a US asset (Brent dropped $1 on that headline), while the Bank of England signaled a rate hike if the war with Iran persists.
Figure 1: Get physical: Oman Brent vs. Brent and WTI

Source: ICE
Crude and gas markets exhibit excessive supply elasticity, with the Brent-WTI spread exceeding $17. Meanwhile, TTF Dutch gas futures rallied by 17%, while US RBOB was up 3%. These differences affect efficient pricing, highlighting Europe’s disadvantage relative to the US in this energy crisis.
Europe imports ~10–11% of Qatar’s LNG in normal years, but in 2022-2023 Qatar exported 79.8 million tonnes of LNG in total, of which 15.1 million tonnes (19%) went to Europe. The countries most reliant on LNG imports from Qatar are Belgium (40%), followed by Italy (45%), Spain, and the UK (each 7%).
Asia imports even more from Qatar. In 2022- 2023, Asia received ~1.24 million tonnes per week from Qatar (22.7% of the total), and the largest importers were China (24%), India (40%), Japan (4%), and South Korea (19%).
Brent is specifically at risk of blowing out to $130 or beyond as the infrastructure wars escalate. For the US, despite a well-supplied domestic energy market, even though refineries go into maintenance by April-May, U.S. gasoline prices track Brent because U.S. refiners pay Brent‑linked prices for crude, and gasoline is priced in a global market, not the US domestic one.
As Brent goes, so do US gas prices, and in turn, those directly affect consumer expectations, which feed into the Fed’s reaction function towards rate hikes if expectations become unanchored.
Figure 2: Brent-WTI spread ($) and US national average ($)

Source: AAA, ICE, CME
Still, the differences in dependency on LNG from the Gulf are duly reflected in stock and bond market performance: Italian and Indian equities are down 2.5 to 3.5 percent, and UK and Italian bond yields are up 9 basis points. Markets are seeking out the weakest links in the energy/gas supply chain and pricing those with an additional risk premium to US assets.
“Ironically,” the conflict has made US assets more ‘favored,’ in terms of relative performance and the dollar, which is up 5 percent since the start of the war, and appears to be the unwitting beneficiary.
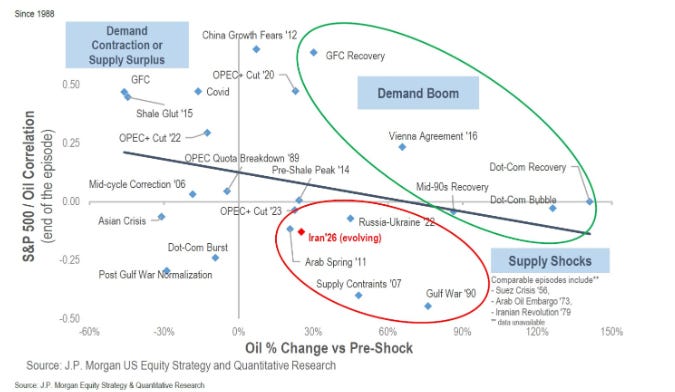
Importantly, the correlation between oil prices and the S&P is turning negative amid this supply shock. This limits, for now, a significant drawdown (S&P -5% vs. global equities -10% from the recent peak).
Since the US policy to control oil prices and the Strait (5000-pound deep-penetration bombs were dropped near the Strait) is not working, US assets will continue to “outperform” foreign markets even if the Administration further escalates the infrastructure war.
Figure 3: S&P correlation with oil
Source: JP Morgan