

Return of the Parabolic
Parabolic moves driven by liquidity can propel equities into the stratosphere

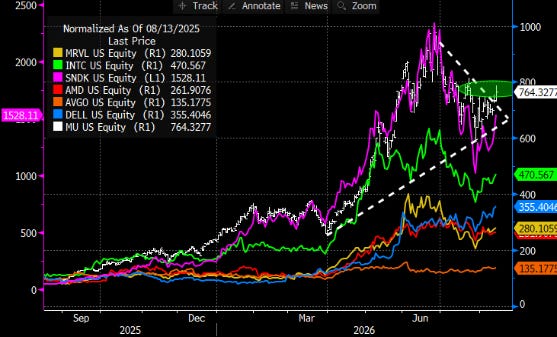
Several of the recently “parabolic” stocks—Micron among them—are mounting a notably strong rebound. Micron, alongside peers such as SanDisk, Marvell, and Dell, has surged 40–50 percent month‑to‑date, reasserting leadership within the Parabolic7 cohort.
Micron remains a bellwether and appears on the verge of a major technical breakout, as suggested by the wedge formation in Figure 1.
The wedge pattern’s width implies potential upside toward a new all‑time high. SanDisk and Marvell are exhibiting similar wedge structures and are beginning to break out, while AMD and Intel are following suit. Dell, meanwhile, has already pushed into new record territory.
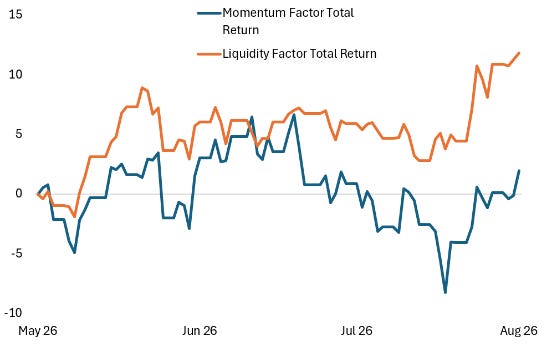
With wedges poised to break, momentum regains strength, but this time for a different reason: the liquidity factor.
Figure 1: Parabolic7s: breaking out, again
Source: FedWatch Advisors/Highline, NYSE
These parabolic stocks exhibit liquidity dynamics that differ sharply from the volatile, crowd‑driven behavior seen in meme shares or momentum stocks.
A parabolic stock climbs on accelerating, conviction‑driven flows—fundamental surprises and momentum buying—meme stocks rise on social contagion and retail coordination; momentum names, reinforced by trend‑following and systematic strategies, develop more orderly liquidity than the crowd‑driven surges that define meme or parabolic moves.
In this market defined by parabolic behavior, liquidity sits atop momentum itself—accelerating the move as buyers once again chase ever‑higher prints. Liquidity drives momentum, so this rally is liquidity-driven. Investors are re-engaging after July’s sell-off, driven by higher-than-expected earnings and renewed AI optimism.
Figure 2: Liquidity Factor versus Momentum Factor (total return, %)
Source: Bloomberg’s Factors to Watch
Despite exhibiting realized volatility above 100 percent, these parabolic names have delivered post‑earnings performance comparable to the Mag7—yet with less than one‑third of the volatility and liquidity.
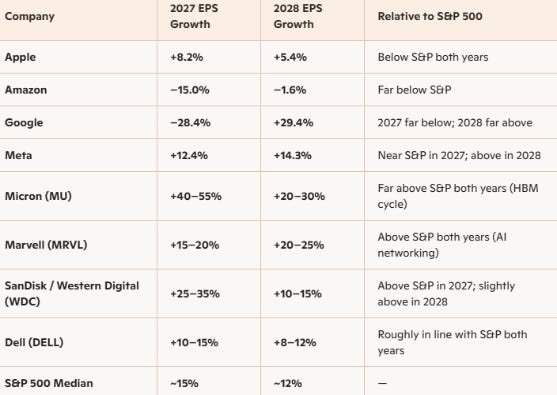
The market’s muted differentiation in volatility premia reflects a simple dynamic: earnings beget earnings. Forward EPS growth expectations for 2027–28 average 18 percent for both the Parabolic7 and Mag7, versus a 12 percent median for the S&P 500 (Table 1).
Table 1: EPS growth rates (Y/Y%) 2027–28
Source: FactSet
With “earnings strength” emerging as the dominant narrative behind August’s broad equity momentum, the renewed advance in parabolic stocks warrants close attention. Should momentum accelerate, these moves could extend beyond the initial seven names and broaden across a wider segment of the market.
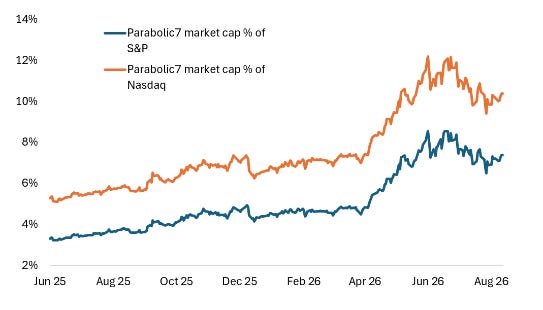
“Parabolic breadth,” which measures the market cap of parabolic stocks as a % of the index’s market cap, is beginning to expand (see Figure 3). The wider this breadth, the more stocks become parabolic and the higher volatility in individual stocks relative to the VIX.
Figure 3: Parabolic breadth (%)
Source: NYSE
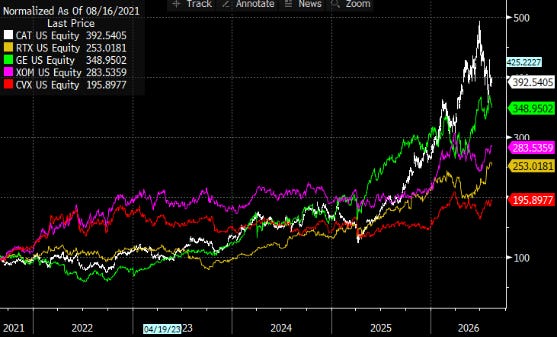
Since July, the stocks showing true parabolic price behavior fall into three clusters: AI semiconductors, AI infrastructure (memory, networking, custom silicon), and a handful of old‑economy cyclicals tied to the AI buildout. The latter group is the latest edition at the tip of becoming parabolic as liquidity spreads through other AI-linked areas.
As such, it is likely to take the current rally into the stratosphere; the inevitable unwind, driven by liquidity this time, could involve a larger group of stocks than was seen during the memory sell-off. Until then, parabolic stocks add to current strength seen in a typically seasonally weak August.
Figure 4: A new set of parabolic stocks
Source: NYSE