

The Davos Indicator

The gathering in the canton of Graubünden, at about 1,560 meters (5,120 feet) above sea level, sits in the Davos Valley along the Landwasser River and is best known as host to the annual World Economic Forum (“WEF”).
Ahead of the event is the WEF’s report published on global cooperation, which has often served as a contra-indicator to market direction; whenever the report is optimistic, reflective of the mood at the event, it is bearish for markets, and conversely.
At the heart is this graph, which attempts to quantify cooperation and shows that cooperation has decreased significantly since 2020, especially in the areas of peace & security (see Figure 1).
For markets and investors, there are tangible implications: a decline in the peace component means defense spending is rising, with material effects on commodities. This year is shaping up to be a “hot year like 2016”, when commodity reflation dominated.
During that year (2016), Davos was defined by a single dominant theme — Mastering the Fourth Industrial Revolution — and world leaders concluded that exponential technological change was reshaping economies faster, global security risks were rising, and growth was weakening.
For most of the same reasons, sentiment at Davos will be influenced by geopolitics, such as now Greenland, tied to tariff threats directly aimed at European countries, and by the President himself attending, setting up an anxious atmosphere at the forum
This “anxiety,” in my view, is likely to be expressed in a further rally in commodities, boosting global equities and yields.
Figure 1: Davos World Economic Forum; declining cooperation (normalized score)

Source: WEF
As such, the three top-performing commodities year-to-date, Silver, Platinum, and Tin (up 18% to 25%), are entering a triple sigma move (see Figure 2). Although these three metals do not drive defense spending (instead, it is rare earth minerals), the sharp price changes indicate they are industrial centers of gravity, with (indirect) weightings in global CPI and PPI of ~1 to 5 percent.
A reason these are affected by geopolitics is that silver responds mainly to safe‑haven flows and trade policy shocks; platinum is highly exposed to supply disruptions in South Africa and Russia; and tin is one of the most supply-concentrated metals on earth, making it extremely vulnerable to political instability in Southeast Asia.
Silver, platinum, and tin affect inflation in industrial supply chains, amplifying producer price pressures, which are once again a main driver of a potential next wave of inflation. This will pose dilemmas for global central banks, as commodities can also loosen financial conditions.
Figure 2: Three-Sigma moves (normalized scale)

Source: Bloomberg Commodity Indices
To that end, central banks may preemptively strike, viewing rising commodity prices as a threat to price stability. Markets are on to this idea, pricing in the implied path of rates in countries more affected by commodities than others (Figure 3).
The Fed’s path, though, stands out (turquoise line in Figure 3) because expectations are not pricing in any effect of the commodity run, even though it is related to (chips/semis) investments into the US.
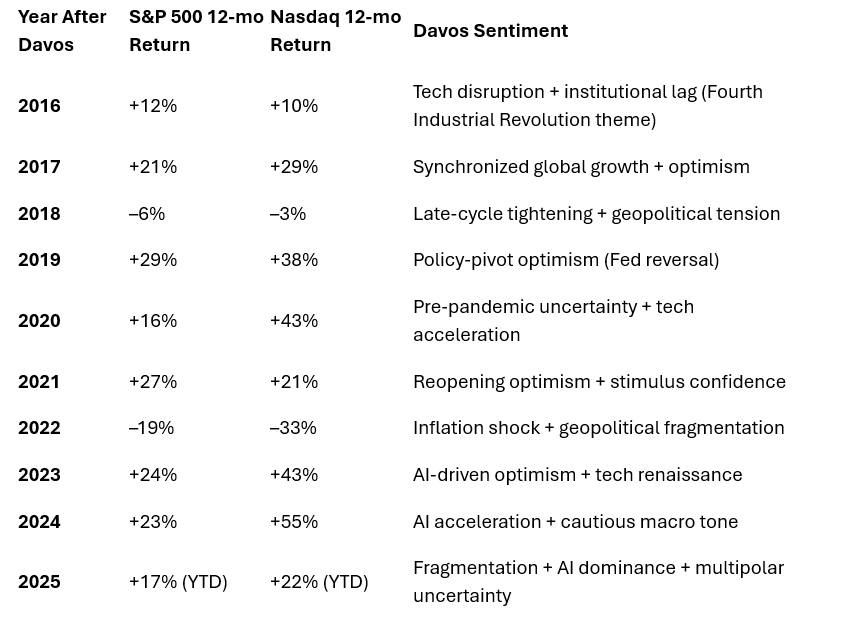
Thus, the sentiment in Davos is (likely) fragile, and may hit a nerve on Wednesday at 11 am ET when Trump delivers his speech. But the market appreciates angst at the forum, and that is likely to continue to see a commodity-driven rally (see Table 1: historical returns post-Davos).
Figure 3: Implied rates path global central banks (%)

Source: CME, Eurex, Intercontinental Exchange
Table 1: S&P and Nasdaq historical returns (%) and Davos Sentiment
I am surprised Dr. copper didn’t make the gold, silver and tin list of metals graph. 🙏