The Evac
Just as China and the US agreed to what they agreed to in Geneva two weeks ago, Israel is ready to launch an offensive against Iran, prompting an "evac” by non-military personnel as Trump signaled a deadlock in nuclear negotiations and upped the ante on reciprocal tariffs.
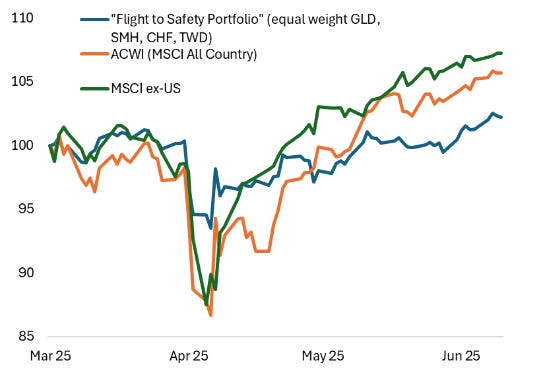
The market translates this trifecta into a flight-to-safety portfolio consisting of Gold, Semiconductors, the Taiwanese dollar, and the Swiss Franc.
This is a benchmark to trade “uncertainty,” the narrative misnomer, which is really about a “butterfly effect,” the flap of the wings (tariffs) in one country, leads to a typhoon (presumptive attack on Iran) on another continent.
The final tariff rate for the US remains unclear, and yet, like the price of rare earth minerals, the effective tariff rate dictates the direction of the US economy.
Figure 1: Flight to Safety Portfolio versus MSCI World and ex-US (normalized scale)
Source: MSCI, FXAll, Ishares, VanEck
Without much pass-through in CPI and PPI from tariffs, the final rate remains uncertain, as the Trump letters setting the deal may lead to the US’s effective (global) tariff rising above 10 percent.
Importantly, Howard Lutnick said in an interview yesterday that (effective) tariffs on China, currently around 33 percent, will stay in place for the next 6 months, the time that China has set for rare earth shipments and export licenses for US companies only.
The fat pitch of the dollar strengthening as trade barriers come down remains in doubt, as some of the US is softening; for example, the 4-week average of claims is up 35,000 since January.
Powell admitted at the last press conference that the Fed was a “little late” when it delivered a 50-basis-point rate cut, implying that if there is further deterioration in the data, the Fed will react preemptively to tariff policy.
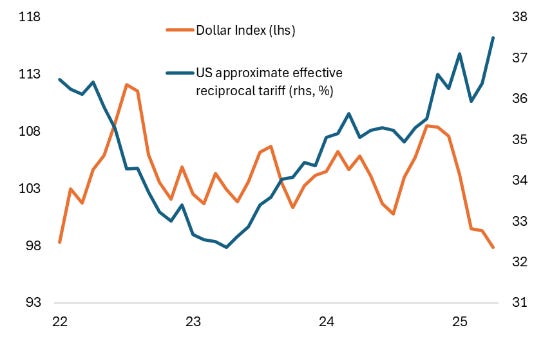
That is the reason why the dollar is weakening and is not participating in the flight to safety. In Figure 1, the performance of the MSCI World ex-dollar may continue as dollar weakness persists, facing fundamental challenges as the market calibrates a new, higher reciprocal tariff (Figure 2).
Figure 2: Dollar Index and US effective reciprocal tariff (%)
Source: US Treasury, Commerce Department, Bloomberg
Thus, to gauge the Fed’s next move, the outperformance of the MSCI ex-US relative to a flight-to-safety portfolio, excluding the dollar, is relevant in the current context of how the 30Y auction may fare today, as the underlying financing markets (“repo”) show a modest strain.
A notable change from recent weeks is that the narrative about the US’s debt sustainability has been questioned by long-term bond investors, who are shorting their long-term assets (e.g., 30-year Treasuries) that they manage on behalf of retirement clients.
Instead of a spike, a summer squeeze in Treasuries is underway, which may temporarily lead to Treasury yields reaching 4.25% to 4.5% on the downside for 10-year and 30-year bonds. A key reason is energy, which once again fails to sustain a rally amid geopolitical concerns, and the oil futures curve is influencing the path of Fed Funds futures into 2026-2027.
Until the tariffs are fully passed through and energy prices recover, the weak dollar, global equities' outperformance outside the US, and volatility in the 30-year long bond remain in place, dictating daily price action.
Figure 3: Oil futures and Fed Funds futures
Source: CME


